


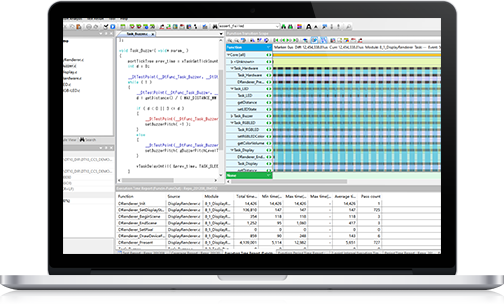
DT10 is the Next Generation Dynamic Testing tool purpose-built for Embedded Software Engineering. It unifies the capabilities of a variety of traditional embedded testing tools into a single powerful solution that works on any embedded software target, independent of the particular embedded OS or CPU.
DT10 provides a suite of powerful features to capture characteristics of the runtime embedded software. Automatic source instrumentation places “Test Points” into key locations throughout the code, facilitating the transfer of vital trace & debug data back to the host PC. Once the data has been captured the DT10 Software analysis engine will generate a collection of reports helping to pinpoint Performance and Functional Defects in the software, along with sets of Graphs and Charts giving a visual representation of the embedded software in action. These reports include Function Execution Time, Code Coverage, Performance Monitor, Event Trace, Variable Monitor, just to name a few. The DT10 Multi-wave Scope even allows Analog and Logic Signals to be captured and analyzed from the target, and correlating with states and transitions in the embedded software.
As embedded software becomes more complex, embedded software developers and testers are increasingly faced with challenge to deliver more with less. Traditional embedded system testing are no longer sufficient. The need to support a wide variety of OS, CPU, cross-compilers, mutli-core, and actual target boards makes it extremely difficult for most of the testing tools to perform any meaningful test execution on target. While host based testing with techniques such as static analysis, unit testing, offer some value in error prevention, actual target testing is required for not only many of the regulatory compliance requirements but also critical to identify those illusive errors that only surface while application is executed on the target device. Even then, due to so many dependencies and variables, errors/bugs do not surface during every execution. These hard-to-reproduce and hard-to-detect errors/bugs require a new generation of dynamic analysis solution.
DT10 is the next-generation embedded testing solution that leverages real-time gray box testing techniques combined with capabilities of function and event tracing, variable monitor, coverage analysis, and many more to deliver embedded software developers and testers the simple, easy to use automatic dynamic testing solution. DT10 is OS and CPU independent which means no customization nor additional coding required for testing on actual target device. DT10 support for multicore allows users to obtain test reports by each executed core and graphical CPU load measurement value. Most importantly, DT10 is capable of long term tracing up to 32 days without stopping the application execution which is critical in uncovering those illusive errors/bugs.

Core Values
-
Resolve complex, sporadic system errors that are difficult to locate in software
-
Verify and optimize the execution time performance of the software
-
Analysis and diagnosis of faults in embedded software systems affected by the interaction between hardware and software
-
Completeness of statistical software system functional testing
-
Comprehensively track and analyze the intermediate processes of dynamic execution in software systems
Main Benefits
-
DT10 provides powerful defect traceability capabilities
-
DT10 provides real-time dynamic coverage analysis updates
-
DT10 supports monitoring and analysis of hardware status during system operation and synchronizes analysis with software status
-
Supports multiple languages such as C/C++, C#, Java, etc.
-
DT10 supports continuous testing for up to one month
-
DT10 offers a wide range of analysis and reporting functions
-
The performance testing function of DT10 can refine any code module and achieve precision down to the nanosecond level
-
Supports tracking and detection of paths, variables, and various intermediate states during software execution
-
Not dependent on the CPU and OS type of the system under test
-
Supports a wide range of interface types, including serial ports, Ethernet ports, asynchronous buses, GPIO, SPI, SD cards, and CAN buses
-
Supports 8-bit/16-bit/32-bit/multi-core CPUs
Main Function
-
Function Transition
-
Variable Monitor
-
Event Trace
-
Multi-wave Scope
-
Code Coverage
-
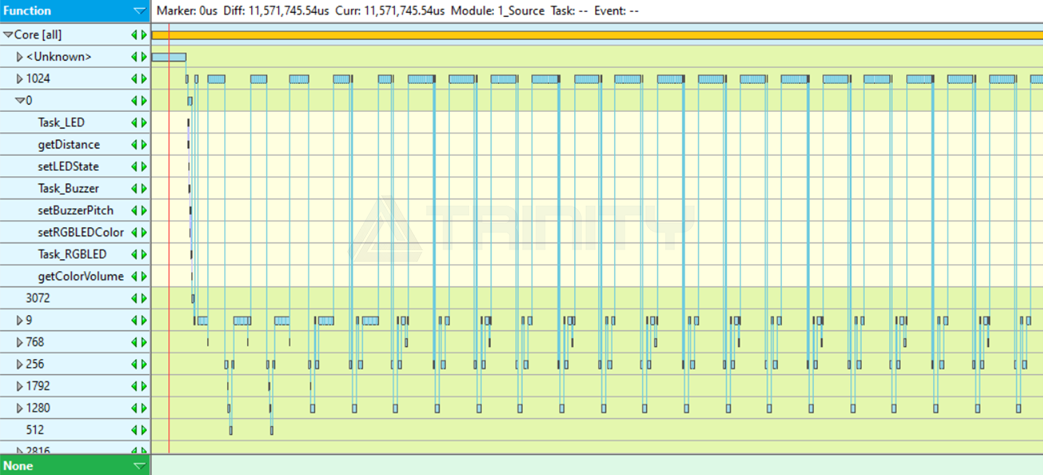
 Function Transition
 Graphical display of timed transitions between functions. Provides visualization of execution path so embedded software engineers can easily identify the timing of which the function is executed and the transition timing of task at a glance.
-
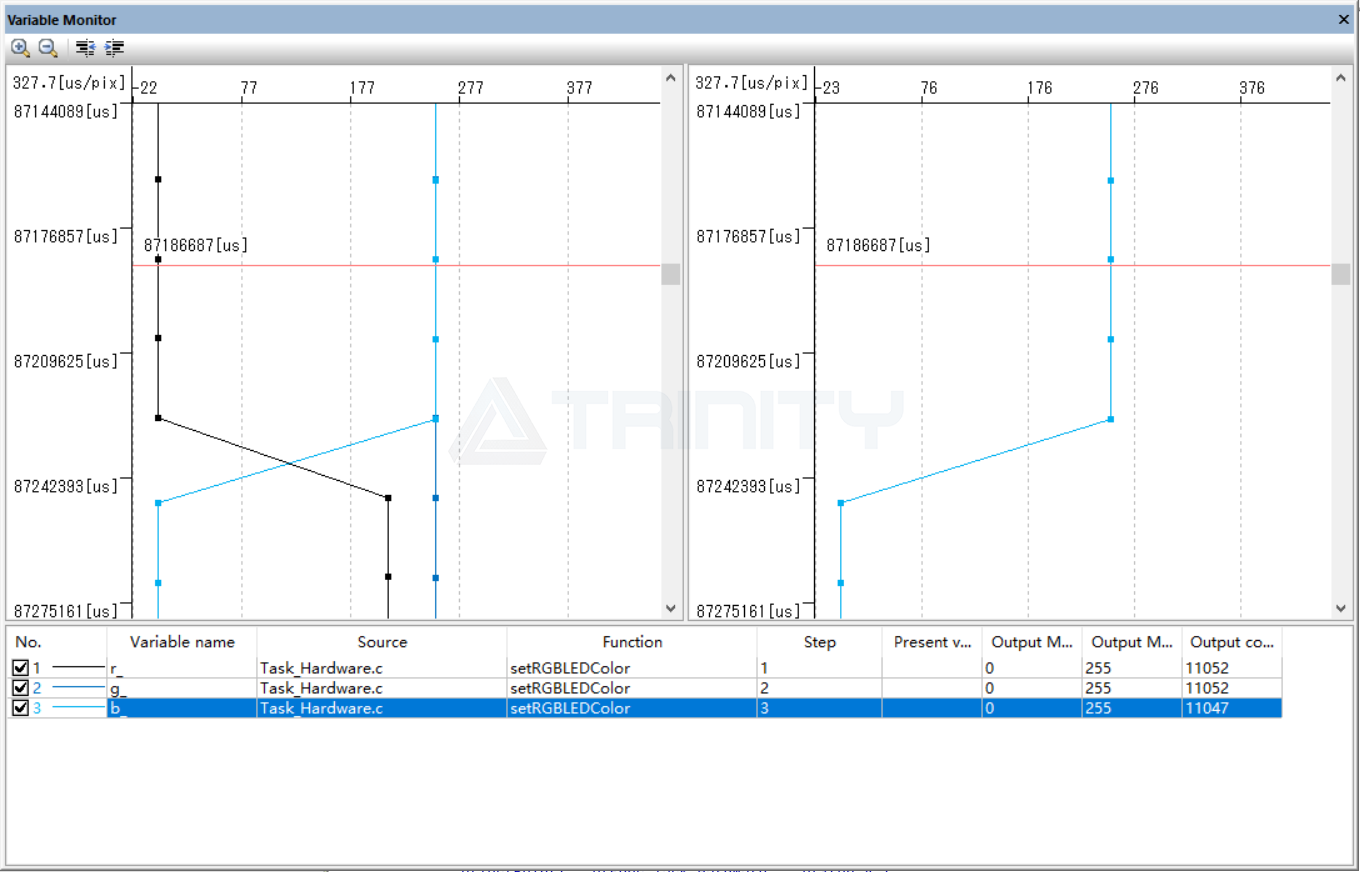
Variable Monitor
Trace the changes in variable value over time. Graphically displays the changes of variables in chronological order allow developers & testers to eaily understand the correlations between variables.
-
Event Trace
Monitor Tash, Status, and Sequence Transition. Visual display of task transition, the status transition, and the sequence transition so you can have a birds-eye-view of the event trace. In addition, it also provides occupation rate and occupation time so you can better analyze your application execution.
-
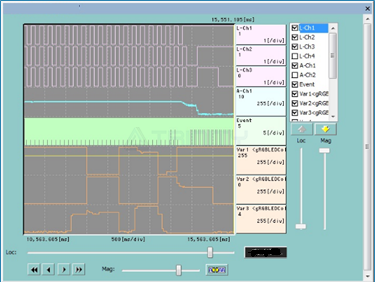
Multi-wave Scope
Enables embedded software developers & testers to finally have a way to verify software trace & hardware status together at the same time. This powerful H/W and S/W synchronization provides embedded software and hardware engineers to finally able to easily identify and distinguish embedded system issues/defects that is coming from the software or hardware side.
-
Code Coverage
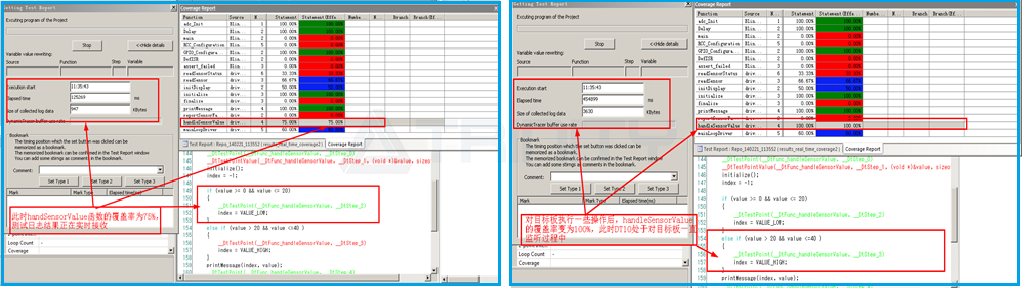
This powerful real-time code coverage report provides embedded engineers statement and branch coverage analysis (C0 and C1) while code is executing on real target. Providing the most effective way to find un-executed process and to check software behavior when verifying a bug/defect.
Supported Environment
Host OS: | Win XP/Visita/7/8/10, etc. |
Target OS: | Unlimited |
Supported compilers: | Unlimited |
Supported target hardware: | Unlimited |
Target communication interface: | Ethernet port, gorge, GPIO, SPI, I2C, SD card, Asynchronous bus, CAN bus, etc. |
Related Resources
Related
